
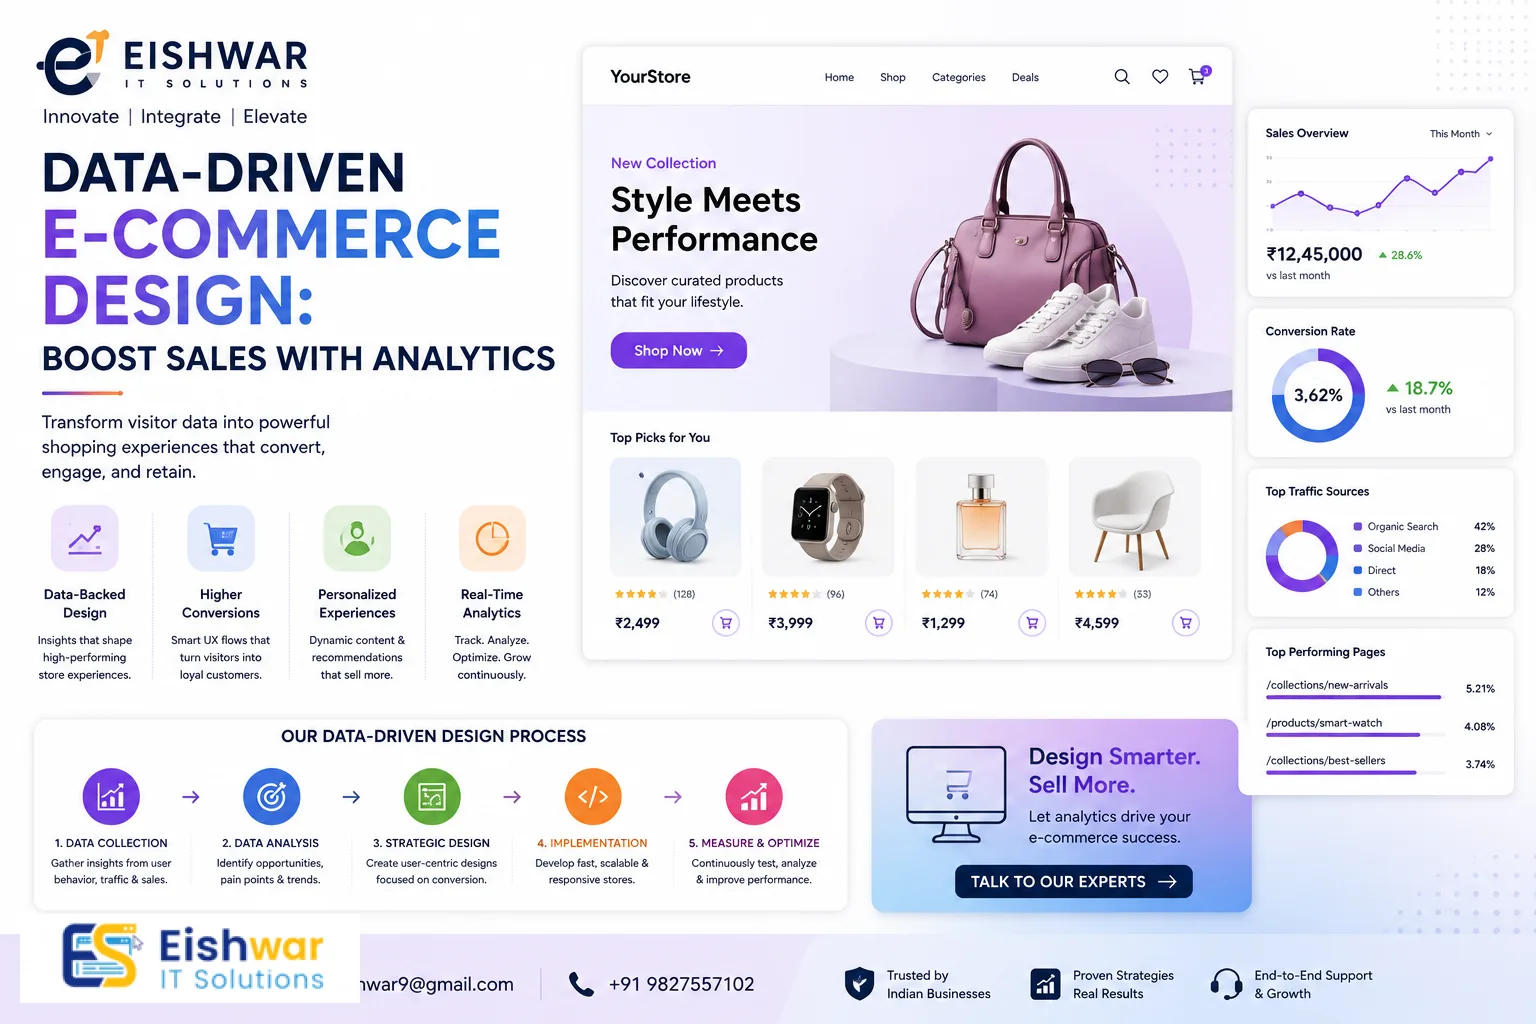
Data-Driven E-commerce Design: Boost Sales with Analytics
Published on: 06 Jul 2026
Data-Driven E-commerce Design: Boost Sales with Analytics
Introduction
In the fast-paced world of e-commerce, intuition alone is no longer enough. Every click, hover, and scroll tells a story—and the best e-commerce websites are the ones that listen. For Indian business owners, marketers, and professionals, leveraging data-driven design is the key to unlocking higher conversions, better user experiences, and ultimately, increased sales. The digital marketplace in India is growing exponentially, with over 800 million internet users and a projected e-commerce market value of $350 billion by 2030. To stand out in this crowded space, you need more than just a visually appealing website; you need a design that is backed by solid evidence and user behavior insights.
Learn more about our Website services
At EishwarITSolution, we believe that great design is measurable. By combining analytics with creative strategy, you can build an e-commerce website that not only looks stunning but also performs exceptionally. In this comprehensive guide, we’ll explore how to use data to inform every design decision—from layout to color choices—and share actionable tips tailored for the Indian market. Whether you’re a small business owner in Mumbai or a marketing professional in Bangalore, this guide will equip you with the tools and knowledge to turn your website into a conversion powerhouse.
Main Section 1: What is Data-Driven Design and Why It Matters
Data-driven design is the practice of using quantitative and qualitative data to guide design decisions. Instead of guessing what your users want, you rely on actual behavior patterns, A/B test results, and analytics to create an experience that resonates. This approach moves beyond subjective opinions and focuses on objective evidence, ensuring that every design element serves a purpose. For example, rather than assuming that a red button will attract more clicks, you test it against a green one and let the data decide.
For e-commerce in India, where diverse user behaviors and device preferences exist, data-driven design helps you cater to a wide audience. Consider this: a recent study showed that 85% of Indian consumers use multiple devices before making a purchase, and 70% prefer mobile payments like UPI. Understanding these nuances through data allows you to design a seamless cross-device experience. For instance, if your analytics reveal that 70% of your traffic comes from mobile devices, you can prioritize mobile-first design, ensuring that navigation, product images, and checkout flows are optimized for smaller screens. Similarly, heatmaps might reveal that users are ignoring your CTA button because of its placement below the fold, prompting you to move it higher for better visibility.
Why it matters: Data reduces risk. It validates hypotheses, uncovers hidden opportunities, and ensures your design budget is spent on what truly drives results. For Indian businesses competing with global giants like Amazon and Flipkart, this approach levels the playing field. A small business in Pune can use data to identify that its customers prefer local language descriptions, leading to a 30% increase in engagement. In essence, data-driven design transforms your website from a static brochure into a dynamic, user-centric platform that adapts to customer needs.
👉 Don't wait for the perfect moment; turn your vision into reality today.
Free ConsultationMain Section 2: Key Data Sources for E-commerce Design Decisions
To implement data-driven design, you need to collect the right data. Here are the most valuable sources for e-commerce, along with practical tips on how to use them effectively:
- Google Analytics: Track user flow, bounce rates, and conversion funnels. Identify where users drop off. For example, if you notice a high exit rate on the payment page, it might indicate issues with payment gateway options or page load speed. Set up custom dashboards to monitor key metrics like session duration, pages per session, and goal completions.
- Heatmaps & Session Recordings: Tools like Hotjar or Crazy Egg show where users click, scroll, and hover. Discover if your product images are being ignored or if your navigation is confusing. For instance, a heatmap might reveal that users are clicking on non-clickable elements, suggesting a need for redesign. Session recordings can also help you understand user frustration, such as repeated attempts to click a broken link.
- A/B Testing Platforms: Test variations of your homepage, product pages, or checkout flow to see which version converts better. Use tools like Optimizely or VWO to run controlled experiments. For example, test two different product page layouts—one with a large hero image and another with a video—to see which drives more add-to-cart actions.
- User Surveys & Feedback: Directly ask users about their experience. For Indian audiences, simple feedback forms after purchase can yield rich insights. Consider using tools like SurveyMonkey or Typeform to gather qualitative data. Ask questions like, “What made you hesitate to complete your purchase?” or “How can we improve your shopping experience?”
- Sales Data: Analyze which products sell best, at what price points, and during which seasons. Use this to inform layout and promotion placement. For example, if data shows that winter clothing sells best in November, you can design a dedicated landing page for that season, featuring top-selling items and limited-time discounts.
For example, an Indian clothing brand noticed through heatmaps that users were not scrolling past the fold. They redesigned their homepage with a cleaner hero section, reduced clutter, and added a prominent “Shop Now” button. The result? A 25% increase in product page visits and a 15% boost in conversions. This real-world example underscores the power of using data to make informed design changes.
Main Section 3: Practical Steps to Implement Data-Driven Design
Here’s a step-by-step process to start using data in your e-commerce design, with detailed explanations and examples:
- Define Your KPIs: Common e-commerce KPIs include conversion rate, average order value, cart abandonment rate, and time on site. But don’t stop there. Consider secondary metrics like click-through rate on product recommendations, email sign-up rate, and social share count. For an Indian business, tracking metrics like UPI payment adoption rate or regional language preference can provide valuable insights.
- Collect Baseline Data: Before making changes, gather at least 30 days of data to understand current performance. This baseline helps you measure the impact of your design changes. Use tools like Google Data Studio to create visual reports that highlight trends and anomalies. For example, if you notice a spike in traffic from a specific city, you can tailor your design to that audience.
- Identify Problem Areas: Use analytics to find pages with high bounce rates or low engagement. For instance, if your product page has a 70% exit rate, something is wrong. Dig deeper: Is the page loading slowly? Are product descriptions too brief? Are images low-quality? Use session recordings to see exactly where users lose interest.
- Formulate Hypotheses: Based on data, guess what might improve the page. Example: “If we move the Add to Cart button above the fold, conversions will increase.” Another hypothesis: “If we add customer reviews below the product image, trust will improve, leading to more purchases.” Ensure your hypotheses are specific and measurable.
- Run A/B Tests: Create two versions of the page and split traffic. Let the test run until you have statistically significant results—typically at least 1000 visitors per variant. Use tools like Google Optimize for simple tests. For more complex experiments, consider using VWO. Remember to test one element at a time to isolate the cause of any improvement.
- Implement Winning Variant: Deploy the design that performed better, and continue testing other elements. For example, after optimizing the CTA button, test the product image size or the placement of trust badges. This iterative process ensures continuous improvement.
For Indian businesses, consider local factors: payment preferences (UPI vs credit card), language options, and festival seasons. Data can reveal that users prefer Hindi language on mobile, prompting you to add a language toggle. Similarly, during Diwali, historical sales data might show that users respond well to festive-themed banners and limited-time offers. By incorporating these insights, you can create a personalized experience that resonates with your audience.
👉 Free Website Audit
Get Free AuditExpert Tips
- Start Small: Don’t redesign everything at once. Focus on one page or element, like the CTA button color. For instance, test a red button against a blue one to see which drives more clicks. Small wins build momentum and confidence.
- Segment Your Data: Analyze behavior by device, location, and traffic source. Mobile users in Mumbai may behave differently than desktop users in Delhi. For example, if data shows that mobile users in tier-2 cities prefer cash on delivery, you can highlight that option prominently on mobile pages.
- Use Qualitative Data: Numbers tell you what is happening, but user interviews tell you why. Combine both for deeper insights. Conduct phone interviews with a few loyal customers to understand their pain points and preferences. This qualitative feedback can reveal issues that analytics might miss.
- Prioritize Load Speed: Data shows that a 1-second delay reduces conversions by 7%. Use tools like PageSpeed Insights to optimize. Compress images, enable browser caching, and minimize JavaScript. For Indian users, who often have slower internet connections, a fast-loading site is critical for retaining visitors.
- Leverage Indian Festivals: Use historical sales data to design special landing pages for Diwali, Durga Puja, or Eid. For example, create a festive-themed homepage with countdown timers, exclusive discounts, and curated gift guides. This not only boosts sales but also enhances brand loyalty.
Common Mistakes
- Relying on Vanity Metrics: High traffic doesn’t mean high sales. Focus on conversion-related metrics like add-to-cart rate and checkout completion. Avoid getting distracted by page views or social media likes, which don’t directly impact revenue.
- Ignoring Mobile Users: With over 80% of Indian internet users on mobile, a desktop-only approach is fatal. Ensure your design is responsive and touch-friendly. Test your site on various devices and screen sizes to guarantee a seamless experience.
- Testing Too Many Variables: A/B tests with multiple changes make it hard to know what worked. Test one element at a time. For example, if you change both the button color and the headline, you won’t know which change caused the improvement.
- Not Acting on Data: Collecting data without implementing changes is a waste. Create a culture of experimentation. Schedule regular review meetings to discuss analytics findings and prioritize design updates. Assign a team member to oversee data-driven initiatives.
- Overlooking Checkout Flow: Many businesses optimize product pages but neglect the checkout. Data often reveals friction here, such as too many form fields or lack of payment options. Simplify the checkout process by offering guest checkout, auto-filling addresses, and displaying progress indicators.
Future Trends
Data-driven design is evolving rapidly. Here’s what to watch for in 2026 and beyond, with implications for Indian e-commerce:
👉 Free Homepage Demo
Book Demo- AI-Powered Personalization: Machine learning algorithms will automatically adjust layouts, product recommendations, and content based on individual user data. For example, an AI system could detect that a user frequently buys organic products and automatically highlight those items on the homepage. This level of personalization can increase conversion rates by up to 20%.
- Predictive Analytics: Anticipate user behavior before they act, allowing proactive design changes—like showing a discount when a user is about to leave. For instance, if data predicts a high cart abandonment rate based on user behavior, the system can trigger a pop-up offering free shipping to encourage completion.
- Voice Search Data: As voice commerce grows in India, analyzing voice queries will inform design for voice-friendly interfaces. With the rise of smart speakers and voice assistants, optimizing for voice search—such as using natural language keywords and conversational design—will become essential.
- Real-Time Heatmaps: Live data streams will let you see user behavior as it happens, enabling instant optimization. For example, if a heatmap shows that a new feature is confusing users, you can immediately roll back the change or add a tutorial.
- Privacy-First Analytics: With stricter data laws like India’s Digital Personal Data Protection Act, use anonymized and aggregated data to maintain trust while still gaining insights. This means shifting from individual tracking to cohort analysis, ensuring compliance without sacrificing data quality.
FAQs
1. What tools are best for data-driven e-commerce design?
2. How much data do I need before making design changes?
3. Can data-driven design work for small e-commerce businesses?
4. What is the biggest mistake in data-driven design?
5. How often should I update my e-commerce design based on data?
6. Is data-driven design expensive?
Conclusion
Data-driven design is a game-changer for e-commerce businesses in India. By listening to what your users are telling you through their behavior, you can create a website that not only attracts visitors but converts them into loyal customers. Start small, test often, and let data guide your creative decisions. Remember, the goal is not to replace creativity but to enhance it with evidence. With the right tools and mindset, you can transform your e-commerce site into a high-performing asset that drives sustainable growth.
At EishwarITSolution, we specialize in building data-optimized e-commerce websites that drive results. Whether you’re launching a new store or revamping an existing one, our team can help you harness the power of analytics to boost your sales. From initial data audit to ongoing optimization, we provide end-to-end support tailored to your business needs.
CTA
Ready to transform your e-commerce website with data-driven design? Contact EishwarITSolution today for a free consultation. Let’s turn your data into dollars! Our experts will analyze your current site, identify key opportunities, and create a customized roadmap to improve your conversions. Don’t let your competitors outpace you—take the first step toward a data-driven future now.