
Invisible UX: How Behaviour Analytics Creates Frictionless Design in 2
Published on: 15 Jun 2026
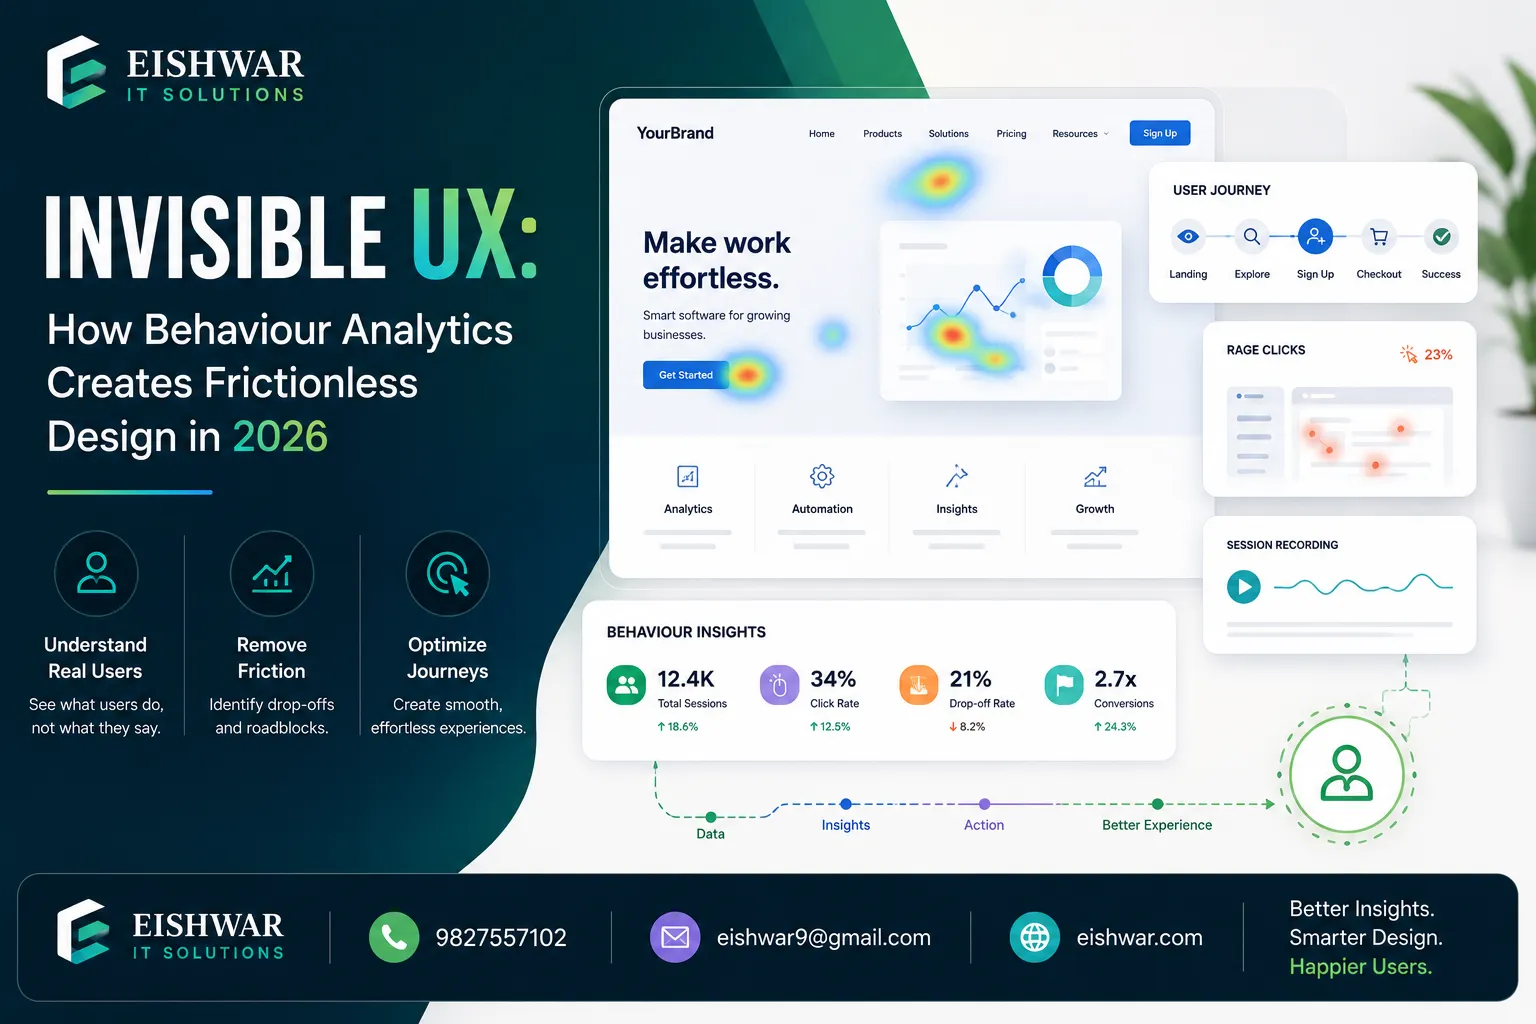
Invisible UX: How Behaviour Analytics Creates Frictionless Design in 2026
Introduction
In 2026, the best user interface is the one users don't notice. Welcome to the era of Invisible UX — a design philosophy that eliminates every moment of confusion, delay, or extra click. Instead of forcing users to adapt to your interface, your interface adapts to them. And the secret ingredient? User behaviour analytics.
Learn more about our Website services
For business owners and marketers in India, this shift is not just a trend — it's a competitive advantage. When your website or app feels effortless, users stay longer, convert faster, and trust your brand more. In this guide, we'll explore how behaviour analytics powers invisible UX, with practical examples you can apply today.
What is Invisible UX and Why It Matters in 2026
Invisible UX means the interface disappears from the user's conscious attention. Think of a smart thermostat that learns your schedule and adjusts temperature automatically — you never touch it. Or an e-commerce site that pre-fills your shipping address because it knows you're ordering for the same location.
Why does this matter? Because every extra second of friction costs you customers. According to a 2025 Google study, 53% of mobile users abandon sites that take longer than three seconds to load. But invisible UX goes beyond speed — it removes cognitive load. Users don't have to think about what to do next; the system guides them intuitively.
For Indian businesses, where mobile-first users are price-sensitive and impatient, invisible UX can directly impact your bottom line. Imagine a food delivery app that predicts your usual order on a Friday evening — one tap and it's done. That's invisible UX driven by behaviour data.
How Behaviour Analytics Powers Invisible UX
Behaviour analytics collects and interprets user actions — clicks, scrolls, hovers, navigation paths, time spent, and drop-offs. When applied correctly, this data reveals patterns that let you design interfaces that anticipate needs.
Here are three ways behaviour analytics fuels invisible UX:
1. Predictive Interfaces: By analyzing past behaviour, your UI can predict what a user wants next. For example, a travel booking site can show the most likely destination based on previous searches and current season. A practical tip: start with a single prediction, like suggesting the most common checkout method for returning users, and measure its impact on conversion rates.
2. Adaptive Content: Behaviour data helps surface the right content at the right time. A news app can prioritize articles similar to those a user reads most, reducing scrolling. For an Indian e-commerce site, this could mean showing regional language product descriptions based on the user's location or past language preferences, making the experience feel native and effortless.
3. Proactive Error Prevention: Analytics can identify common mistakes users make (e.g., entering wrong date formats) and automatically correct or suggest the right input before the error occurs. For instance, a booking platform can detect when a user types a date in the wrong format and auto-correct it, or highlight the correct format in a tooltip. This small change can reduce form abandonment by up to 15%.
Tools like Hotjar, Mixpanel, and Google Analytics 4 (GA4) provide the raw data. The real magic lies in interpreting that data to remove friction points. For example, using GA4's funnel analysis, you can see exactly where users drop off and then apply predictive design to smooth that step.
👉 Don't wait for the perfect moment; turn your vision into reality today.
Free ConsultationImplementing Invisible UX: A Step-by-Step Framework for Indian Businesses
Ready to make your interface disappear? Follow this practical framework:
Step 1: Map the Ideal User Journey
Identify the smoothest path a user can take from landing to conversion. Use behaviour analytics to see where they deviate or drop off. For example, if 40% of users abandon your checkout at the payment page, that's a friction zone. Use session recordings to watch exactly what happens — do they hesitate, encounter errors, or get distracted? This insight guides your redesign.
Step 2: Identify Friction Points
Look for high click rates on non-clickable elements, repeated form errors, or excessive back-and-forth navigation. Heatmaps and session recordings are goldmines here. For instance, if a heatmap shows users clicking on an image expecting it to be a link, consider making it clickable. Or if users repeatedly enter invalid PIN codes, add an inline validator that suggests correct formats.
Step 3: Design for Anticipation
Once you know the friction points, redesign to remove them. If users frequently search for 'return policy', surface it automatically on the product page. If they always select 'COD', make it the default payment option. A real-world example: an Indian fashion retailer noticed that 60% of users selected 'Cash on Delivery' but had to scroll to find it. By making COD the default, they saw a 12% increase in checkout completions.
Step 4: Test and Iterate with A/B Testing
Roll out your invisible UX changes to a small segment first. Use behaviour analytics to measure if friction decreases and conversions increase. Then iterate. For example, test two versions of a product page: one with a static 'Add to Cart' button and one where the button changes color and size based on user scroll behavior. Track which version leads to more purchases.
Step 5: Personalize at Scale
Use machine learning to apply invisible UX patterns to different user segments. A returning customer sees a different homepage than a first-time visitor — both feel effortless. For instance, a returning user might see recently viewed items and personalized recommendations, while a new visitor sees a simplified onboarding flow. This segmentation ensures that invisible UX doesn't become one-size-fits-all.
Expert Tips
- Start with micro-interactions: Small wins like auto-completing addresses or remembering user preferences build trust. Use analytics to find the most frequent micro-actions users repeat. For example, if data shows that 80% of users enter their phone number first in a form, auto-focus that field to save a tap.
- Use session replay sparingly: Record only a sample of sessions (e.g., 5%) to avoid data overload. Focus on users who convert and those who drop off to spot differences. This targeted approach helps you identify patterns without drowning in data.
- Combine qualitative and quantitative data: Numbers tell you what happened; session recordings and surveys tell you why. Invisible UX needs both. For instance, if analytics show a high drop-off on a pricing page, watch recordings to see if users are confused by the layout or pricing tiers.
- Prioritize mobile-first: Over 70% of Indian users access the internet via mobile. Design invisible UX for small screens first — larger screens are easier to adapt later. Test on low-end devices and slow networks to ensure your predictive features don't add latency.
- Respect privacy: Always get consent and anonymize data. Invisible UX should never feel creepy. Explain why you collect data and how it benefits the user. For example, a simple tooltip saying 'We remember your preferences to save you time' can build trust.
Common Mistakes
- Over-personalization: Showing too many predictions can overwhelm users. Example: An e-commerce site that suggests 20 items based on one click — keep it to 3-5 relevant suggestions. Use analytics to determine the optimal number of recommendations that lead to clicks without clutter.
- Ignoring edge cases: If you design for the majority, you may alienate power users. Always test with different user personas. For instance, a power user might prefer manual input over auto-fill, so provide a toggle to disable predictions.
- Assuming analytics tells the full story: Numbers can mislead. A high bounce rate might mean fast answers, not poor design. Always validate with user feedback. For example, a high bounce on a FAQ page could indicate users found answers quickly, not that they left in frustration.
- Making changes without A/B testing: Invisible UX changes can backfire if not tested. For example, auto-filling a form field might cause errors if the user intended a different value. Always run A/B tests to compare conversion rates before and after.
- Forgetting accessibility: Invisible UX should work for everyone. Ensure predictive features have fallbacks for screen readers and keyboard navigation. For instance, auto-complete suggestions should be announced by screen readers, and users should be able to navigate them with keyboard arrows.
Future Trends
By 2028, invisible UX will evolve into anticipatory design — where interfaces act before the user even thinks. Key trends to watch:
👉 Free Website Audit
Get Free Audit- Biometric integration: Interfaces that adjust based on eye tracking, heart rate, or facial expressions. Example: A meditation app that senses stress and starts a breathing exercise. For Indian users, this could be integrated with affordable wearables like smartwatches.
- Voice-first invisible UX: Smart speakers and voice assistants will handle complex tasks without any screen interaction. In India, where voice search is growing rapidly, designing for voice-first interactions can capture a large user base.
- AI-generated interfaces: Dynamic UIs that change layout and content in real-time based on behaviour patterns. For example, a news app might rearrange its homepage based on the time of day and user's reading history.
- Cross-device continuity: A user starts a task on phone, finishes on laptop — the interface remembers every step seamlessly. This is crucial for Indian users who often switch between devices during their day.
- Ethical invisible UX: As privacy laws tighten, brands will need to balance invisibility with transparency. Users will control how much the interface 'knows' about them. Providing clear privacy dashboards and opt-out options will become standard.
FAQs
- What is invisible UX? Invisible UX is a design approach where the interface anticipates user needs and removes friction, making interactions feel effortless and natural. It's about creating experiences that users don't have to think about.
- How does behaviour analytics help in designing invisible UX? It reveals user patterns, pain points, and preferences, allowing designers to create predictive and adaptive interfaces that minimize user effort. For example, analytics can show that users often search for a specific feature, so you can surface it automatically.
- Is invisible UX expensive to implement? Not necessarily. Start with free tools like Google Analytics and Hotjar, then invest in more advanced analytics as you scale. The ROI from increased conversions often outweighs the cost. A small change like auto-filling a form can pay for itself within weeks.
- Can invisible UX work for B2B websites? Absolutely. B2B users appreciate streamlined workflows, predictive search, and personalized dashboards. Behaviour analytics can identify common tasks and automate them. For example, a B2B portal can auto-populate order forms based on past purchases.
- What are the privacy concerns with invisible UX? Collecting user data requires transparency and consent. Always comply with India's Digital Personal Data Protection Act (DPDPA) and give users control over their data. Use clear language to explain data usage and provide easy opt-out options.
- How long does it take to see results from invisible UX? Small changes (like auto-filling forms) can show impact within weeks. Larger redesigns may take 3-6 months to fully optimize. The key is to start with high-impact, low-effort changes and iterate based on data.
- What tools are best for behaviour analytics in India? Google Analytics 4, Hotjar, Mixpanel, and Clearbit are popular. For Indian businesses, consider tools with local server options for faster data processing, such as those offered by Indian cloud providers. Also, tools like FullStory and Amplitude offer advanced session replay and funnel analysis.
Conclusion
Invisible UX is not about magic — it's about using behaviour analytics to understand your users so deeply that your interface becomes an enabler, not an obstacle. For Indian businesses, this approach can dramatically improve conversion rates, customer satisfaction, and brand loyalty.
👉 Free Homepage Demo
Book DemoStart small. Pick one friction point from your analytics data, design a solution that anticipates the user's next move, and test it. Over time, your interface will fade into the background, leaving only a seamless experience that keeps your users coming back.
CTA
<p>Ready to make your UX invisible? <a href='http://eishwar.com/contact'><strong>Contact EishwarITSolution</strong></a> today for a free behaviour analytics audit and discover how we can help you design frictionless interfaces that boost conversions.</p>